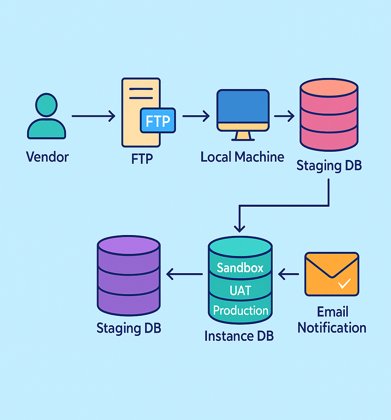
QTI Import and ETL Process
Developed a comprehensive ETL (Extract, Transform, Load) system using SSIS to process and transform QTI assessment data into a data warehouse, supporting multiple QTI formats and versions.

ETL pipelines, data warehouses and dashboards that turn scattered data into reports people trust.
Most businesses already have the data they need; it is just spread across systems, spreadsheets and formats. We build pipelines that collect and clean it, warehouses that hold it in one place, and dashboards that answer real questions about sales, operations and performance. Our team has built large ETL processes for assessment data, management dashboards for finance and operations, and analytics platforms for education.
Yes. We map where your data lives, build pipelines to bring it into one database or warehouse, and keep it updated automatically.
Yes. We can connect to what you already have and design dashboards around the questions your team asks most.
It depends on your needs: from near real time to nightly. We set the schedule with you.
Projects where our team used this work in production.
Developed a comprehensive ETL (Extract, Transform, Load) system using SSIS to process and transform QTI assessment data into a data warehouse, supporting multiple QTI formats and versions.
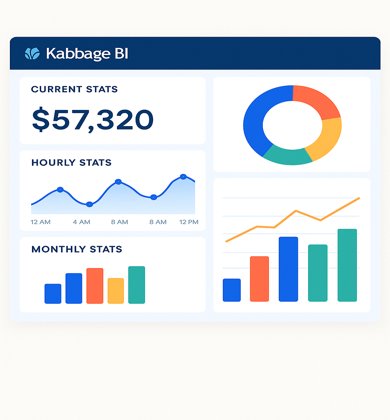
Designed comprehensive dashboards and reports for management, providing real-time insights into financial and operational metrics, along with a hybrid mobile app.

Developed a comprehensive educational analytics platform for visualizing college assessment data using interactive charts, graphs, and dashboards.